
I use my adjusted goals model to generate probabilities for each Premier League match.The international break gives a chance to assess the model to find out if it’s beating the market.
For an initial assessment of my model’s overall performance against the market I’ve used a Brier score method (explained here in a good article by Pinnacle). The lower the score, the better the model is at predicting.
For market odds I’ve used the maximum market odds for each match, and also the closing Pinnacle odds (both available from football-data.co.uk). These have been adjusted to remove the Bookies’ margin (the over-round), which is pretty much zero for maximum market odds and 2% for Pinnacle [demonstrating the value in Pinnacle’s odds – pity they’re not available in the UK] . The results are as follows:
| Brier Score Match result | Brier Score |
| Model | 63.12 |
| Max market odds (day before) | 62.77 |
| Pinnacle closing prices | 62.59 |
So far the model is under-performing the market as a predictive tool. Unsurprisingly, closing market prices are the best estimate. But they are close, which is interesting as there are frequently large discrepancies between the model and market for individual matches.
Next test – how has it performed as a basis for betting tips? Earlier in the year I discussed Risk vs Reward in staking plans, and suggested using the Kelly staking method (but with a maximum of 3% of pot). The table below shows the profit or loss so far, using this method with a £333 pot (so maximum bet is £10).
| Max Market odds | Pinnacle odds | ||||||
| Outcome | Bet | Profit | Return % | Outcome | Bet | Return | |
| H | £505.29 | £38.86 | 7.7% | H | £385.67 | £71.40 | 18.5% |
| D | £216.63 | £38.73 | 17.9% | D | £190.73 | -£7.54 | -4.0% |
| A | £582.12 | -£105.13 | -18.1% | A | £396.59 | -£60.75 | -15.3% |
| Total | £1,304.04 | -£27.54 | -2.1% | Total | £972.99 | £3.11 | 0.3% |
| >2.5 | £473.17 | -£17.10 | -3.6% | ||||
| <2.5 | £389.69 | -£50.41 | -12.9% | ||||
| Total | £862.87 | -£67.51 | -7.8% | ||||
So, loss making – other than for Pinnacle closing prices, which would have broken even.
I’m also posting value bets, using this modelling, on Tipstrr.com – to keep a record of how it performs over the season based on specific bets. The peculiar thing here is that my “tips” based on the same model are showing a spectacular return of 16% for the season. Why the difference? It’s mainly because the available odds are different – meaning I’ve tipped for fewer matches than the analysis above, and also because I’ve often used Asian Handicap odds rather than odds for the individual match result.
What about results for individual teams? The table below shows the Brier score for each team’s matches, against the market.
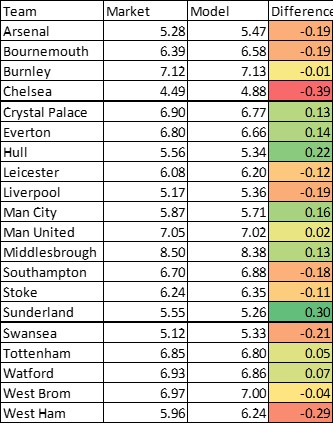
This shows that the model has been particularly bad at assessing Chelsea and West Ham so far. For Chelsea it clearly hasn’t adjusted enough for the improvement since last season.
So the conclusion is that there’s no evidence yet that the model has an edge on the market. However it also shows that results can be vary significantly when using different odds and staking plans – even if they are determined by the same underlying model.
Also, 11 matches per team is a small sample. My aim is to do a proper full review at the end of the season. Despite not yet beating the market’s Brier score I think that the model is showing promise and I’m getting more data to help refine it.
