Forecasting international tournaments is tricky, because it’s difficult to robustly assess the relative strengths of the competing teams. Unlike league football, we only have a small sample of recent international matches to use for analysis – and these are far from perfect, because of the differing strengths of opponents, the mix of competitive and friendly matches and changes to team and squad composition.
For previous tournaments I’ve analysed the strength of every player in every squad, based on their club form and the strength of that club’s league, to create overall team ratings. However, I don’t have time to do that this year. So I’ve searched for different sources of easy to use data to compile team strength rankings.
I started with each team’s goals and shots record over the last 12 months. This gives information about attacking and defensive strength, and also the type of team tactics (i.e. are they an attacking or defensive team?). However, this is of limited value for the reasons articulated in the first paragraph. So I’ve also used FIFA rankings and Transfermarkt squad values to enhance the ratings. I’ve used this to provide overall attacking and defensive strength, as follows:
| Rank | Team | Goals For | Goals against | Difference |
| 1 | France | 1.97 | 0.61 | 1.36 |
| 2 | Belgium | 2.05 | 0.82 | 1.23 |
| 3 | England | 1.76 | 0.54 | 1.22 |
| 4 | Portugal | 1.79 | 0.99 | 0.80 |
| 5 | Spain | 1.58 | 0.79 | 0.80 |
| 6 | Italy | 1.43 | 0.82 | 0.61 |
| 7 | Germany | 1.93 | 1.36 | 0.57 |
| 8 | Netherlands | 1.54 | 1.24 | 0.30 |
| 9 | Denmark | 1.39 | 1.16 | 0.23 |
| 10 | Croatia | 1.66 | 1.51 | 0.15 |
| 11 | Switzerland | 1.50 | 1.42 | 0.09 |
| 12 | Sweden | 1.19 | 1.33 | -0.14 |
| 13 | Wales | 0.71 | 0.88 | -0.16 |
| 14 | Poland | 1.23 | 1.42 | -0.19 |
| 15 | Austria | 1.20 | 1.49 | -0.29 |
| 16 | Turkey | 1.46 | 1.84 | -0.38 |
| 17 | Ukraine | 1.44 | 1.87 | -0.42 |
| 18 | Slovakia | 0.94 | 1.61 | -0.66 |
| 19 | Russia | 1.11 | 1.79 | -0.68 |
| 20 | Czech Republic | 0.97 | 1.68 | -0.70 |
| 21 | Scotland | 0.62 | 1.35 | -0.73 |
| 22 | Hungary | 0.93 | 1.66 | -0.74 |
| 23 | Finland | 0.94 | 1.98 | -1.04 |
| 24 | North Macedonia | 0.81 | 2.02 | -1.21 |
I realise these ratings aren’t perfect and in an ideal world I’d be incorporating far more information – but I think they give a reasonable assessment.
I’ve then used these to simulate the results for each match in the tournament using the model I’ve used for previous Euros and World Cups. For each tournament simulation I’ve assumed these are a central estimate of each team’s attacking and defensive strength – but the strengths are normally distributed with a standard deviation of 0.3. So in each simulation, teams have different strengths. The result of each match is randomly generated, based on team strengths and an assumed average goals scored in each round (these are based on analysing previous tournaments).
| Average Goals | |
| Round 1 group stage | 2.43 |
| Round 2 group stage | 2.52 |
| Round 3 group stage | 2.63 |
| Knockout | 2.2 |
The third match in the group stage tends to have more goals as there is often greater incentive for teams to get a certain result. For knockout stages the simulations also include the possibility of extra time and penalties.
I normally incorporate a home team advantage of 0.40 goals for the hosts (by adjusting both teams’ goals) but for Euro 2020 there isn’t a single host – also home advantage may not be as strong due to limited capacities. So I’ve used an arbitrary adjustment of 0.2 goals for teams playing at home. This is where England have the strongest potential advantage, because if they top their group and progress to the final, then they will play all but one game at Wembley.
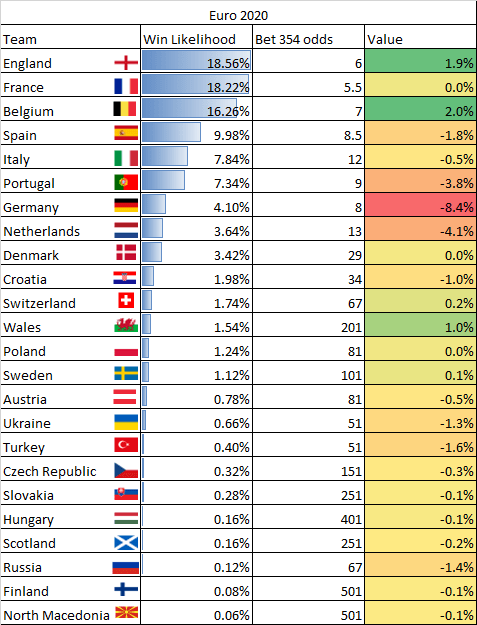
The overall results based on 5000 simulations are as follows: