Just 22 goals were scored in the final round of group matches, averaging 1.8 per game. Group F provided the only incentive fuelled high scoring denouement. Perhaps the 24 team structure generated more caution than usual for the final group matches, as this is historically the highest scoring stage of a tournament.
As a result my model overestimated the number of goals in the 3rd round of matches, forecasting 28.4 goals compared with the 22 goals actually scored. The market (sporting index) priced in 26.5 goals.
Scoring rates usually decline again in the knockout stages (but they can’t really get much lower).
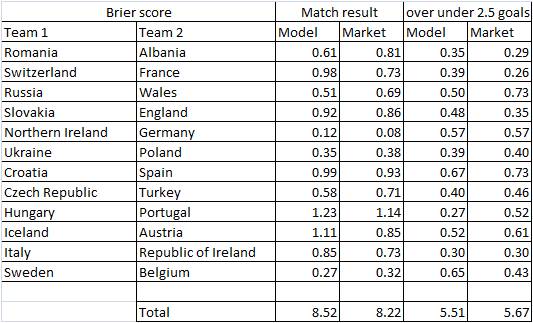
To assess my model’s performance against the market I’ve used a Brier score method (explained here in a good article by Pinnacle). The lower the score, the better the model is at predicting.
For this round of matches the model didn’t perform as well as the market – although it did identify value in Albania and Wales. As with earlier rounds the modelled performed poorly for Group F – continually overestimating Austria and underestimating Hungary. The model did, however, outperform the market for over/under 2.5 goals.
Data

Brier Score