As expected the scoring rate has increased in the second round of group matches, to 2.1 from 1.8 per game in the first round of matches. This reflects the need of some teams to eschew their initial caution. Even so, scoring rate is still historically low, in previous tournaments the average rate for the second round has been at around 2.4.
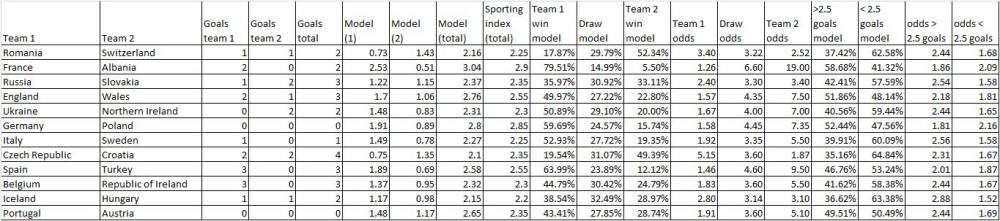
As a result my model overestimated the number of goals in the 2nd round of matches, forecasting 26.9 goals compared with the 25 goals actually scored. Interestingly the market (sporting index) also priced in 26.9 goals, the same as my model.
Usually the defensive shackles come off even more in the final group matches, so I’ll allow for increased scoring in my model.
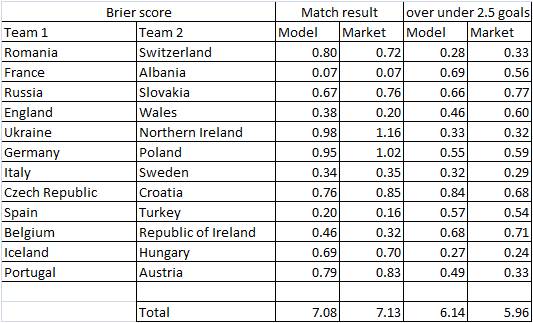
To assess how my model’s performed against the market I’ve used a Brier score method (explained here in a good article by Pinnacle). The lower the score, the better the model is at predicting.
Pleasingly for this round of matches, my model has outperformed the market for the match result market. But the market has done better for over/under 2.5 goals.
Data
Brier Score