So as the dust (and moths) settle on Euro 2016, I’m able to review the full performance of my model. Before the tournament I created a model that rated teams using the strength of their underlying players, which in turn were evaluated using the adjusted goals rating of their club teams (explained here).
Tournament and individual match modelling also took account of typical tournament match profiles (e.g. usually fewer goals and more draws than club football).
Model Performance
Overall the model performed well – very close to the betting market. The pre tournament projection identified value in Portugal for the tournament (as well as Spain). The model also did well in @futbolmetrix1 sophisticated prediction contest – narrowly beating the market (Betfair).
For a full assessment of my model’s overall performance against the market I’ve used a Brier score method (explained here in a good article by Pinnacle). The lower the score, the better the model is at predicting.
Across all individual matches the model slightly underperformed the market, with a Brier score just above the best odds from oddschecker.com. The model did have successes – particularly Wales, but underestimated Hungary and Iceland.
Overall underlying player strength proved a good assessment of a team’s ability. But other factors clearly play a part; such as team tactics, player fitness and motivation. A key learn is how to build these in to the model without applying too much subjectivity.
Another lesson for modelling is tournament goals. I took account of the typical tournament match profile – usually low goals in the first round of group matches, increasing for the second and third, then reducing for the knockout matches. However I didn’t adjust enough.
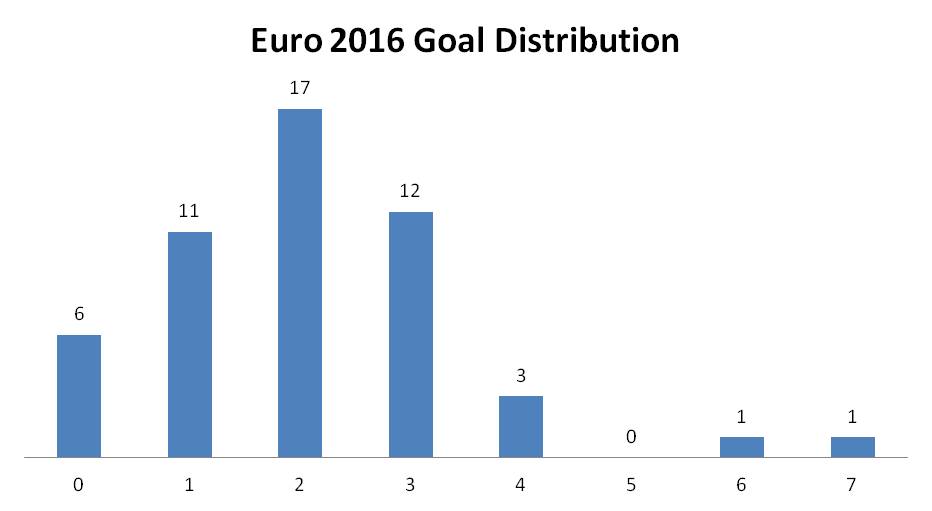
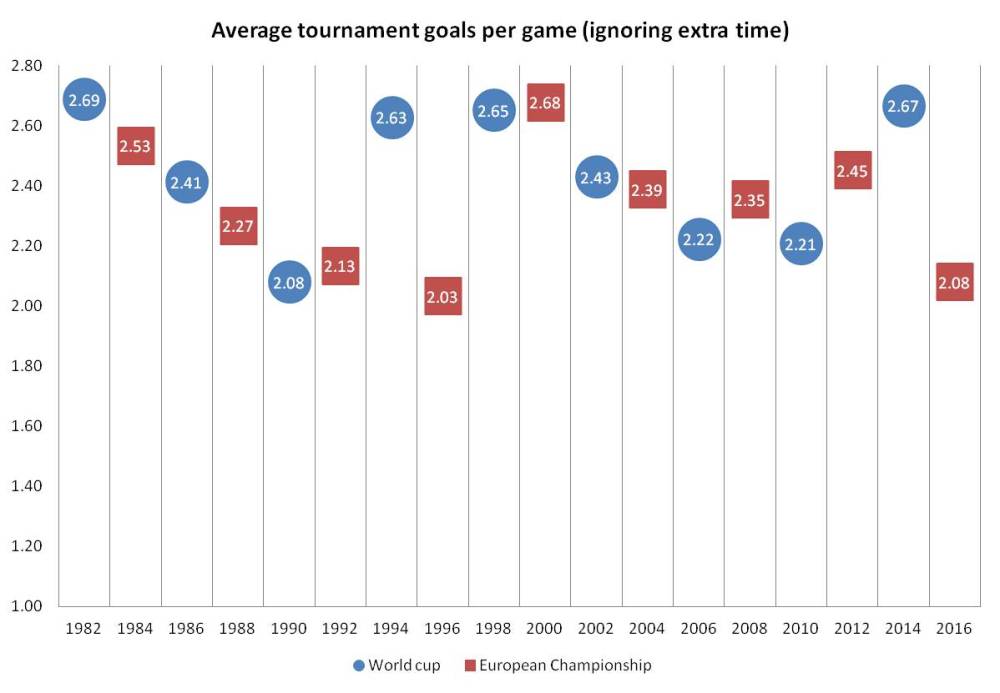
This was a low scoring tournament, with average goals of 2.08 per match – the lowest since Euro 1996. Defences generally prevailed, and we failed to get a goal increase for the 3rd round of group matches – possibly due to the 24 team format – where a draw in the final match is often enough to qualify (think France v Switzerland). Typically most of the knockout matches were cautious, with teams becoming increasingly inhibited towards the end of matches.
The market also overestimated goals scored. Average goals priced by the market were 2.32 (Sporting Index) and a bet on fewer than 2.5 goals in every match would have yielded 79% return! The key lesson here for me is to take more account of team tactics and motivation.
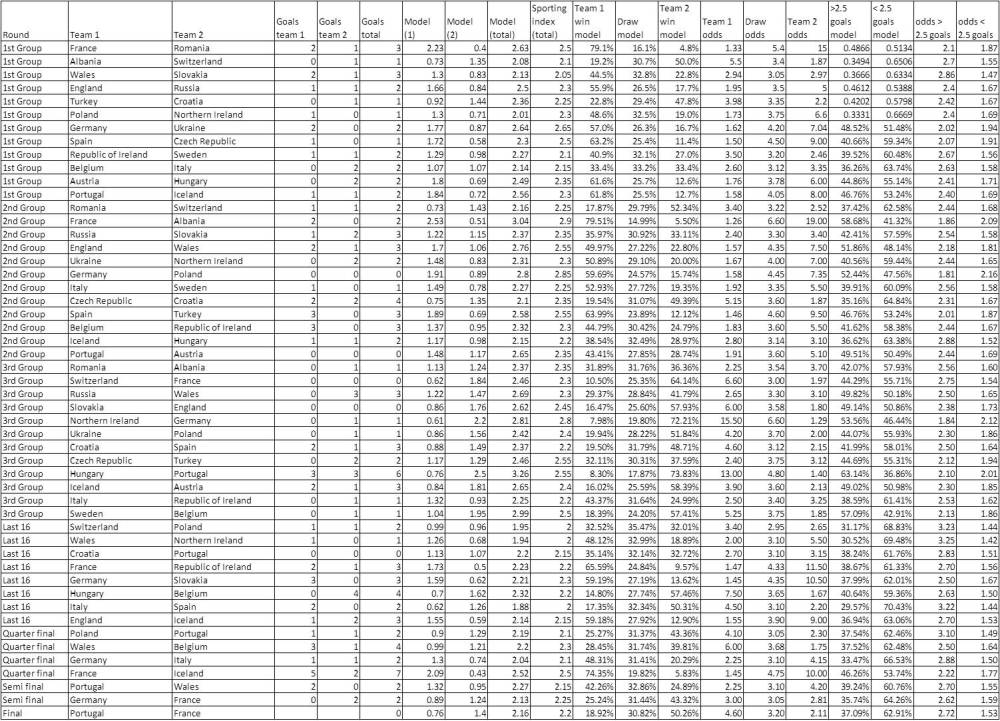
Euro 2016 Goal Data

Brier Score
| Brier score | Match result | over under 2.5 goals | |||
| Team 1 | Team 2 | Model | Market | Model | Market |
| France | Romania | 0.07 | 0.10 | 0.47 | 0.44 |
| Albania | Switzerland | 0.38 | 0.34 | 0.24 | 0.26 |
| Wales | Slovakia | 0.47 | 0.66 | 0.27 | 0.22 |
| England | Russia | 0.88 | 0.81 | 0.43 | 0.33 |
| Turkey | Croatia | 0.41 | 0.45 | 0.35 | 0.33 |
| Poland | Northern Ireland | 0.41 | 0.27 | 0.22 | 0.34 |
| Germany | Ukraine | 0.28 | 0.22 | 0.47 | 0.48 |
| Spain | Czech Republic | 0.21 | 0.17 | 0.33 | 0.46 |
| Republic of Ireland | Sweden | 0.70 | 0.72 | 0.31 | 0.27 |
| Belgium | Italy | 0.67 | 0.74 | 0.26 | 0.28 |
| Austria | Hungary | 1.21 | 1.09 | 0.40 | 0.34 |
| Portugal | Iceland | 0.95 | 0.98 | 0.44 | 0.34 |
| Romania | Switzerland | 0.80 | 0.72 | 0.28 | 0.33 |
| France | Albania | 0.07 | 0.07 | 0.34 | 0.44 |
| Russia | Slovakia | 0.67 | 0.76 | 0.36 | 0.29 |
| England | Wales | 0.38 | 0.20 | 0.54 | 0.41 |
| Ukraine | Northern Ireland | 0.98 | 1.16 | 0.33 | 0.32 |
| Germany | Poland | 0.95 | 1.02 | 0.55 | 0.59 |
| Italy | Sweden | 0.34 | 0.35 | 0.32 | 0.29 |
| Czech Republic | Croatia | 0.76 | 0.85 | 0.25 | 0.35 |
| Spain | Turkey | 0.20 | 0.16 | 0.44 | 0.46 |
| Belgium | Republic of Ireland | 0.46 | 0.32 | 0.35 | 0.33 |
| Iceland | Hungary | 0.69 | 0.70 | 0.27 | 0.24 |
| Portugal | Austria | 0.79 | 0.83 | 0.49 | 0.33 |
| Romania | Albania | 0.61 | 0.81 | 0.35 | 0.29 |
| Switzerland | France | 0.98 | 0.73 | 0.39 | 0.26 |
| Russia | Wales | 0.51 | 0.69 | 0.50 | 0.32 |
| Slovakia | England | 0.92 | 0.86 | 0.48 | 0.35 |
| Northern Ireland | Germany | 0.12 | 0.08 | 0.57 | 0.57 |
| Ukraine | Poland | 0.35 | 0.38 | 0.39 | 0.40 |
| Croatia | Spain | 0.99 | 0.93 | 0.35 | 0.31 |
| Czech Republic | Turkey | 0.58 | 0.71 | 0.40 | 0.46 |
| Hungary | Portugal | 1.23 | 1.14 | 0.80 | 0.48 |
| Iceland | Austria | 1.11 | 0.85 | 0.48 | 0.40 |
| Italy | Republic of Ireland | 0.85 | 0.73 | 0.30 | 0.30 |
| Sweden | Belgium | 0.27 | 0.32 | 0.65 | 0.43 |
| Switzerland | Poland | 0.62 | 0.67 | 0.19 | 0.19 |
| Wales | Northern Ireland | 0.41 | 0.39 | 0.19 | 0.18 |
| Croatia | Portugal | 0.69 | 0.70 | 0.29 | 0.24 |
| France | Republic of Ireland | 0.19 | 0.16 | 0.30 | 0.27 |
| Germany | Slovakia | 0.26 | 0.16 | 0.29 | 0.32 |
| Hungary | Belgium | 0.28 | 0.25 | 0.33 | 0.26 |
| Italy | Spain | 1.04 | 0.92 | 0.17 | 0.19 |
| England | Iceland | 1.19 | 1.27 | 0.27 | 0.26 |
| Poland | Portugal | 0.72 | 0.70 | 0.28 | 0.21 |
| Wales | Belgium | 0.77 | 1.09 | 0.28 | 0.31 |
| Germany | Italy | 0.75 | 0.71 | 0.22 | 0.23 |
| France | Iceland | 0.11 | 0.15 | 0.43 | 0.39 |
| Portugal | Wales | 0.50 | 0.47 | 0.31 | 0.26 |
| Germany | France | 0.48 | 0.63 | 0.26 | 0.28 |
| Portugal | France | 0.77 | 0.74 | 0.28 | 0.26 |
| Total | 31.03 | 30.92 | 18.47 | 16.93 | |
Full data