
Introduction
The coronavirus pandemic has thrust forecasting models into the mainstream spotlight. They’re now recognised as essential tools to guide government policies that could prevent or cause many thousands of deaths. Whilst it’s reassuring that such grave political decisions are influenced by models built by experts, there’s a lack of transparency about assumptions and potential outcomes.
In the daily UK coronavirus press briefings, it’s great to see data presented by scientific professionals to illustrate the effect of policy. But what we don’t see is the expected progression of deaths and hospitalisations. In some ways this is understandable – using actual data (even if incomplete) is dealing with facts – rather than future projections, which could look foolish when reviewed a couple of weeks later.
But there is a real need for transparency. The media’s repeated questioning of government, asking when lockdown will end, could be much more satisfactorily answered by illustrating future scenarios modelled – and demonstrating how these may be affected by actual experience. Instead, the government now states five conditions that must be satisfied before relaxing lockdown – without explaining how these impact potential outcomes.
The future is highly uncertain (and possibly alarming) but thorough justification would inspire increased confidence in the government’s leadership. Modelling can effectively illustrate why it’s vital to accumulate robust evidence before taking a decision to remove lockdown – because outcomes are highly sensitive to key assumptions (such as infection rate, immunity level for recovered cases and the proportion of asymptomatic cases). Get any of these wrong and it could have horrendous consequences.
Instead, we get snippets of information about models used to guide policy. For example, in March the press reported that Imperial College’s modelling indicated 250,000 would have died from coronavirus under previous government policy. On 17 April 2020 it was reported that a public health professor suggested that we could see 40,000 UK deaths as a result of the government’s slow response.
The model’s purpose
Given the fragmented narrative surrounding pandemic modelling – I’ve sought to build my own model, to try and make sense of the numbers we’re seeing and understand the future outcomes of possible policy decisions.
I have never built a model to forecast viruses (and before the crisis I’m not sure I knew what an epidemiologist does), so I may omit fundamental elements. But I have some experience of building models to forecast future events. Here, I’m trying to create a simple framework to reconcile the various figures quoted in the media, as well as understand the impact of potential future options.
I explain the process I went through to build the model, from scratch, below – using parameters that I believe are appropriate to include.
Also, like all models, it’s only as good as its assumptions. I’ve calibrated it with assumptions that appear plausible based on available data and are consistent with the reported UK death and hospitalisation figures. But at this stage the assumptions aren’t necessarily robust (I’ll continually review these as we get more data) – the main objective is to illustrate the mechanics of how the virus progresses over time.
The model is intended to apply to a single location – with assumptions appropriate to that location. It could be a country, a city (e.g. London or New York) or a region within a country. I’ve calibrated it for UK, but it could be used for any location with amended assumptions.
To add a further layer of sophistication I’d like to develop the model into a series of interconnected locations (i.e. countries and cities within countries) each with their own assumptions, dependent on the factors affecting that specific location – allowing for movement between locations, as happens in the real world. But it doesn’t yet do this.
The process of building the model
Once someone’s infected there are two possible end outcomes – recover or die. Death numbers, understandably, get the headlines. But to forecast these end outcomes effectively, the model needs to take account of different stages individuals may go through to get to these outcomes – this then helps answer other important policy questions such as:
- How many people will be infected?
- Will hospital bed capacity be exceeded?
- Will ICU capacity be exceeded?
I’ve included 5 events that infected individuals may go through to get to the end outcomes and have assigned probabilities to each of them, these are:
Symptomatic or not?
Understanding how many people are symptomatic or asymptomatic (not showing any symptoms) is important as it affects how quickly virus spreads through the population and the end mortality rate.
Is hospital needed?
For those with symptoms, what proportion will need hospital treatment? This will drive the forecast for hospital bed capacity needed.
Is hospital accessed?
Even if hospital treatment is needed, it won’t always be accessed. This may, sadly, be because individuals are unable to request help or bed capacity is exceeded.
Is ICU needed?
For those hospitalised, how many will need ICU – this helps forecast ICU capacity.
Is ICU accessed?
For those that need it, can they access ICU? This is driven by ICU capacity.
Each of these events (and their likelihoods) will determine the proportion of people ending up in each outcome, which are illustrated in a probability tree diagram below.
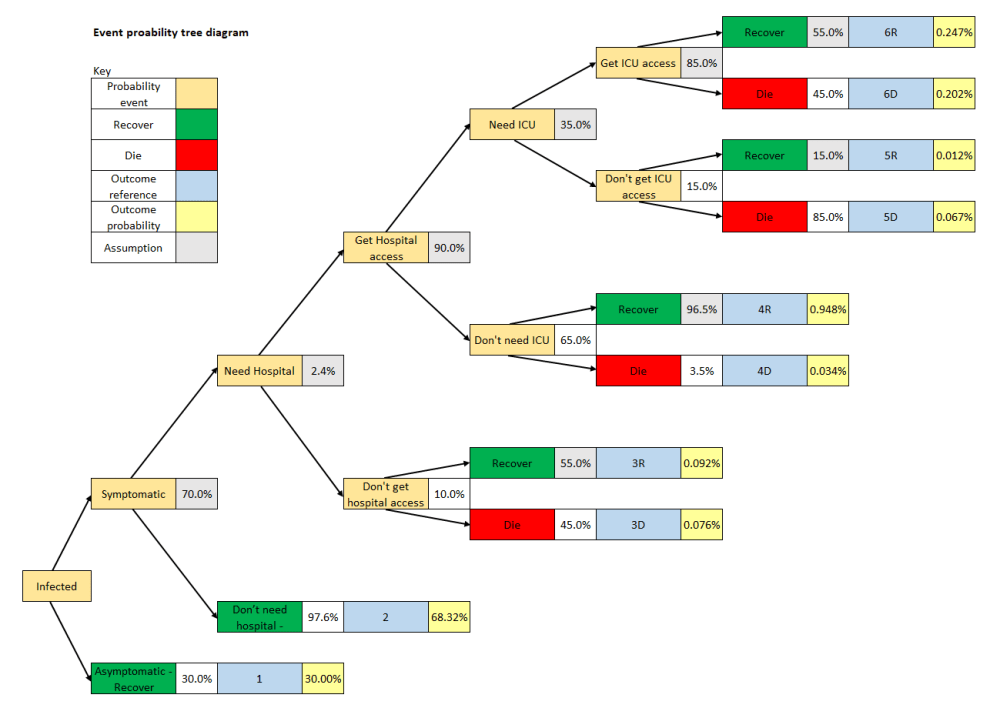
I’ve included example assumed probabilities in the tree, to illustrate how it works. But in the model, they’re not static, but can change over time – for example the proportion of individuals accessing hospital or ICU will reduce if capacity is exceeded. Also, hopefully mortality rates and ICU referrals reduce over time as healthcare professionals understand more about how to better treat the virus.
This produces 6 possible outcomes for infected individuals
- Asymptomatic (30%)
I’ve assumed that all asymptomatic cases recover
- Symptomatic, don’t need hospital (68.3%)
I’ve also assumed that all these cases recover
- Symptomatic, need hospital, don’t get access to hospital
For this outcome individuals could recover or die – which I’ve represented with references 3R (0.092% recovered) or 3D (0.076% die)
- Symptomatic, need hospital, get access to hospital, don’t need ICU
Reference 4R (0.948%) represents individual recovered, 4D (0.034%) represents individual dies
- Symptomatic, need hospital, get access to hospital, need ICU, don’t access ICU
Reference 5R (0.012%) represents individual recovered, 5D (0.067%) represents individual dies
- Symptomatic, need hospital, get access to hospital, need ICU, access ICU
Reference 6R (0.247%) represents individual recovered, 6D (0.202%) represents individual dies
Each of these outcomes have several stages that individuals pass through and each of those stages has an average duration. For example, an individual in outcome 6D goes through the following stages:
- Stage 1. No symptoms (average 5 days). In this stage the individual is infected but displaying no symptoms.
- Stage 2 (average 7 days). Symptoms but not yet hospitalised.
- Stage 3 (average 3 days). Individual is hospitalised but not in ICU.
- Stage 4 (average 6 days). Individual is in ICU.
- Stage 5 (average 3 day). Individual dies, but death is not yet reported (this accounts for any reporting delay)
- Stage 6 – death reported.
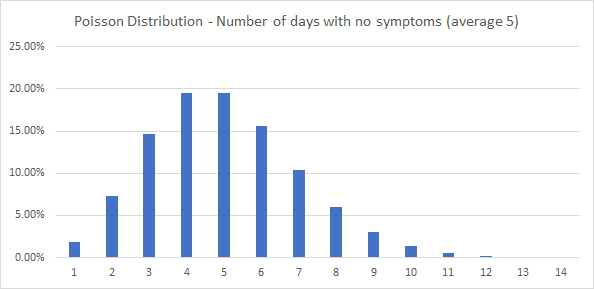
In practice, each of the stages has a distribution of durations around the average. For example – even though the average duration for no symptoms is 5 days, some people will have no symptoms for fewer days, some for more days (e.g. 7 days). To account for the distribution of all durations I’ve assumed a Poisson Distribution (this is a distribution for a discrete number of events around the mean – so can be used for a discrete number of days). The Poisson Distribution is illustrated in the chart below. I’ve assumed that each duration has a maximum of 20 days.
The stages and assumed durations for all outcomes are in the appendix.
Further assumptions
Infection rate
A key assumption is the infection rate. That is, the number of people each infected person infects. As a central assumption, I’ve assumed the infection rate is 0.248 people per day. So, if an individual is infected for an average of 12.1 days – they will infect an average of 3.0 additional people in total. However, this assumption is dynamic over time and can be reduced by policy decisions such as lockdown.
For the UK lockdown, I’ve assumed that the lockdown measures take the daily infection rate down to 0.075, which implies an R0 of 0.91 (below the magic number of 1).
So, it’s an important assumption to test the potential outcomes of different strategies.
There are many factors that could influence the infection rate by geographical location, such as population density, age distribution, pollution, use of public transport, climate, use of masks. As the virus progresses more research will become available about factors that affect the infection rate.
Imported cases
The virus needs to start from somewhere. In the model I’ve assumed that it comes from imported cases. The model makes an assumption about the number of daily imported cases – here I’ve assumed that 5 infected cases were imported on 25/01/2020, rising to a maximum of 765 a day and reducing to 76 a day after lockdown measures were introduced across the world. This assumption can change over time and will be affected by border control, lockdown policy and how well the outside world is dealing with the virus.
Immunity
What happens to recovered cases? I’ve assumed that most recovered cases (98%) gain immunity to virus over the modelling period. Another key assumption. Outcomes will be very different if this isn’t true.
Starting population
Starting population is needed to model how many people are susceptible to the virus. For UK modelling I’ve used 67m as the starting population.
Modelling the virus over time
The model puts together all these assumptions to track the progress of the population from day to day. From one day to the next, people will progress through the stages (based on the probabilities) – and then ultimately be counted as recovered or died. So, we can keep count of people in each of these categories.
- Never infected
- Recovered
- Died
- Infected – outcomes 1, 2, 3R, 3D, 4R, 4D, 5R, 5D, 6R, 6D. Each of these outcomes are split into their stages and each of these stages has a possible period of 20 days.
On the first day there are no infected cases – but we can assume that (say) 20 imported cases enter. These are split across the 6 outcomes, based on the underlying probabilities. So, for example, as the probability of outcome 4R is 0.948% then 0.1896 of the 20 people will enter this outcome – for imported cases I’ve assumed that they enter on day 4 of the no-symptoms stage. On the second day (based on the Poisson Distribution) 26% of these 0.1896 people will move to day 1 of the stage of showing symptoms, whilst 74% will move to day 5 of no symptoms. All the outcomes work in the same way – all with an end outcome of recovery or death.
For day 2, as well as the cases that were infected on day 1, newly infected people will join. The number of newly infected cases joining is the product of the number of currently infected people, the daily infection rate and proportion of the general population susceptible to the virus. At the start I’ve assumed that 100% of the population can catch the virus. But as more people recover, based on assumed immunity, the proportion of the population susceptible reduces. The introduction of a vaccine would also reduce the proportion vulnerable. The newly infected cases are split across the outcomes, in line with the calculated probabilities, and all enter on day 1 of the no-symptoms stage.
The model progresses in the same way across every day in the time period under consideration to determine the impact of the virus. On each day it can count useful information such as:
- Number of deaths (inside and outside hospitals)
- Number infected (split for example between symptomatic and asymptomatic)
- Number of recoveries
- Number needing hospital
- Number needing ICE
Reviewing the results
To start, I need to reiterate that this is an early version of the model – it’s not been peer reviewed, I’ve not fully researched the assumptions and it’s not been fully sense checked. But the early results may help the debate – and indicate areas of the model that need to be revised.
As mentioned, I’ve used assumptions that produce consistent outcomes to the UK figures to date, across several different measures – which can be seen from the graphs below [updated to compare against UK figures reported 26/04/2020]
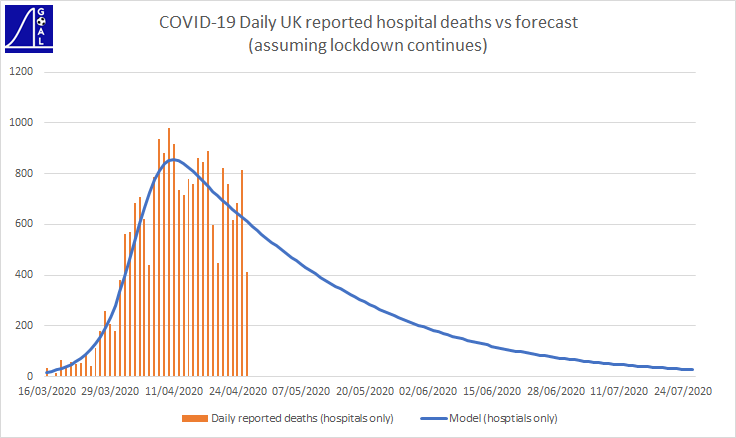
The Government reports daily hospital death figures – these aren’t perfect data as reporting of deaths is often sporadic – so we see volatile swings from day to day. But they are the numbers that get the headlines. My model includes an assumption about reporting delays, so it can track these figures on a consistent basis.
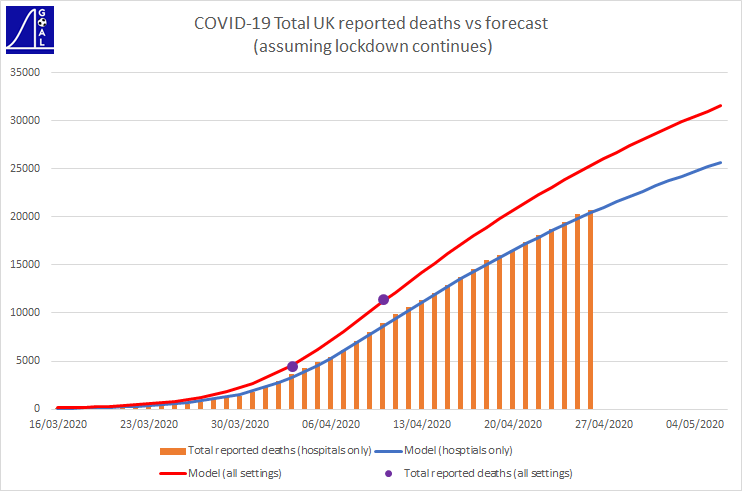
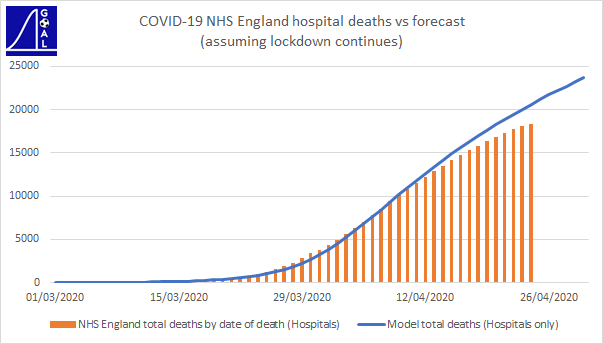
Showing total hospital deaths reveals a more consistent trend than daily amounts. The graph above also shows the model’s forecast for total deaths (including those outside hospital). The Government report total deaths from all settings (not just hospitals) via the ONS.
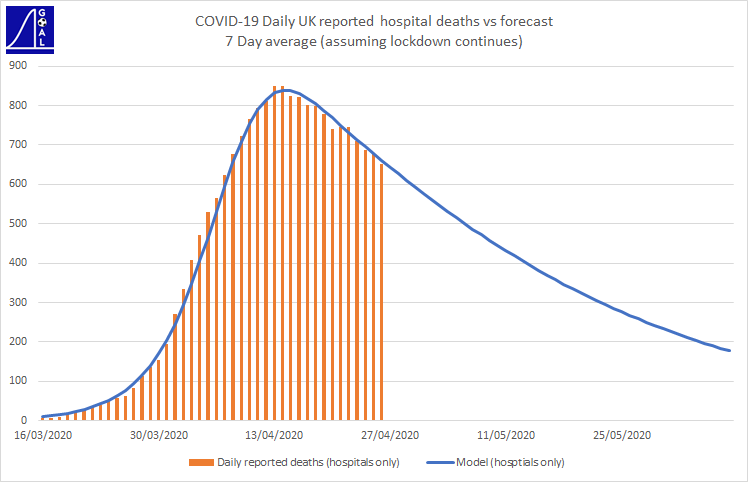
Showing an average of the last 7 days also reveals a smoother trend for daily death numbers.
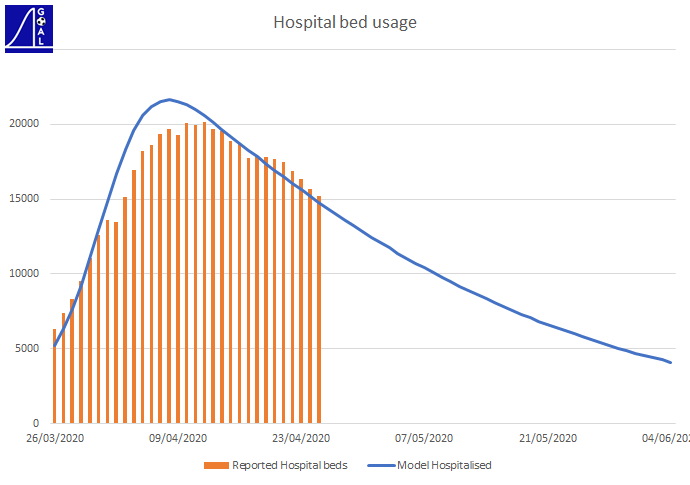
The number of hospitalisations are also consistent with reported figures
To overcome issues with figures using reported date, we can use date of death data. However, for this there will be a reporting lag. The graph below shows the comparison of my model against total NHS England hospital deaths, on date of death. You can see the impact of the reporting lag for the most recent days.
Forecasting outcomes
But, the more important function of the model is forecasting. The grim news from this is that – even if we keep the lockdown in force – based on the model, the UK will see around 48,000 deaths in total from coronavirus. And, in this scenario, full immunity isn’t achieved. The better news from this scenario is that daily deaths fall below 200 a day from the start of June 2020.
The model can be used to forecast the impact of different scenarios for relaxing lockdown.
Next steps
I’m going to use the model to look at future scenarios in more detail – e.g. considering what the optimal strategy might be, assessing whether border controls are sensible and analysing hospital and ICU capacity. I’ll also look to refine the assumptions and further sense check the model (e.g. by applying it to locations other than UK), to better understand its deficiencies and improve it as we get more data.
I’m tweeting daily comparisons of my forecasting model against UK reported figures on @goalprojection
Appendix
Stages and assumed durations for all outcomes
6R
| Stage | Average duration (days) |
| No Symptoms | 5 |
| Symptoms, not hospitalised | 7 |
| Symptoms, hospitalised, not ICU | 3 |
| Symptoms, hospitalised, ICU | 6 |
6D
| Stage | Average duration (days) |
| No Symptoms | 5 |
| Symptoms, not hospitalised | 7 |
| Symptoms, hospitalised, not ICU | 3 |
| Symptoms, hospitalised, ICU | 6 |
| Die, not reported | 3 |
5R
| Stage | Average duration (days) |
| No Symptoms | 5 |
| Symptoms, not hospitalised | 7 |
| Symptoms, hospitalised, not ICU | 11 |
5D
| Stage | Average duration (days) |
| No Symptoms | 5 |
| Symptoms, not hospitalised | 7 |
| Symptoms, hospitalised, not ICU | 10 |
| Die, not reported | 3 |
4R
| Stage | Average duration (days) |
| No Symptoms | 5 |
| Symptoms, not hospitalised | 7 |
| Symptoms, hospitalised, not ICU | 4 |
4D
| Stage | Average duration (days) |
| No Symptoms | 5 |
| Symptoms, not hospitalised | 7 |
| Symptoms, hospitalised, not ICU | 6 |
| Die, not reported | 3 |
3R
| Stage | Average duration (days) |
| No Symptoms | 5 |
| Symptoms, not hospitalised | 10 |
3D
| Stage | Average duration (days) |
| No Symptoms | 5 |
| Symptoms, not hospitalised | 10 |
| Die, not reported | 5 |
2
| Stage | Average duration (days) |
| No Symptoms | 5 |
| Symptoms, not hospitalised | 7 |
1
| Stage | Average duration (days) |
| No Symptoms | 12 |

One Comment Add yours