
International football is a strange beast, for the period in-between tournaments it’s an irritating punctuation –offering sporadic qualifiers or sterile friendly matches – unwelcome to players, managers and fans alike. Yet international tournament football has a capacity to engage and unify unlike any other form of the game (or probably any other sport).
International football is also an interesting challenge to analyse. In contrast to domestic league football, where vast quantities of data exist to assess team and player performance in a variety of conditions, negligible relevant data is available for international football. It is, by its nature, infrequent – so tournament line-ups may bear little resemblance to those of previous matches – with sparse data to assess how they fare in truly competitive circumstances.
But the challenge of analysing international football is also a fascinating opportunity, because no-one else will have adequate data either – this levels the playing field for those that don’t usually have access and resources to carry out full analysis. And, for those that like to bet, international tournament football can offer some great value.
So, in the run-up to World Cup 2018 I’ll try to provide a variety of insight that might inform how the tournament will unfold, and use it to estimate the likelihood of different outcomes (including the winner!) in a similar way to my Premier League projections.
To start with I’ll ignore the actual teams and groups and just consider whether there are any lessons in how major tournaments typically play-out.
Goals per game
Despite providing some of the most iconic football moments, many tournament matches are dull and cautious. In all World Cups and European Championships played since 1982, average goals scored are around 2.4 per match for both competitions (within 90 minutes), compared with 2.7 across Europe’s top domestic leagues.
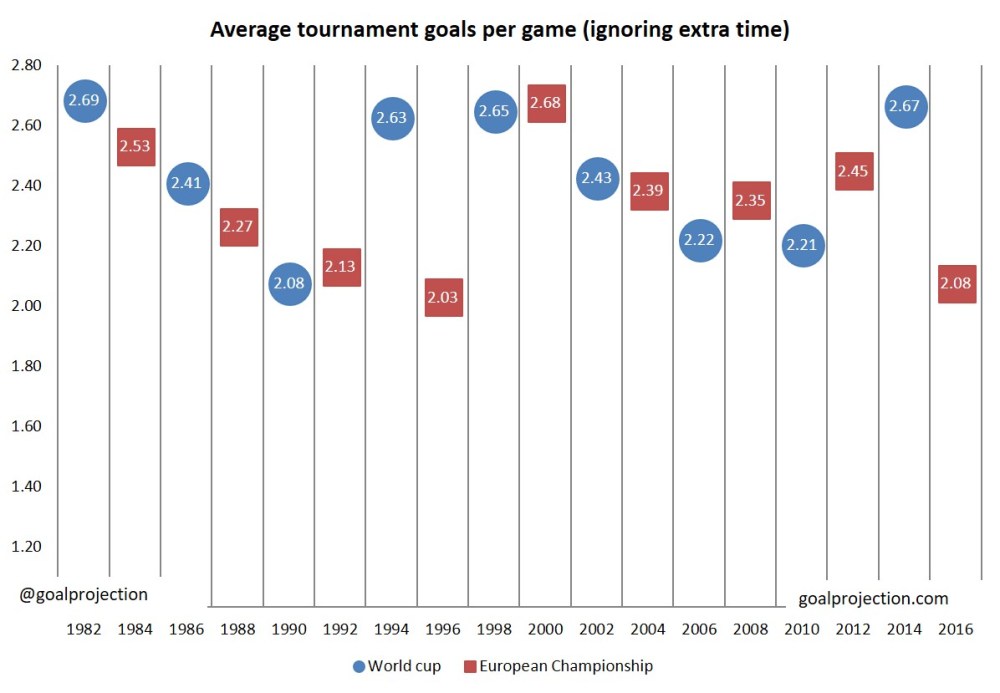
The graph shows the distribution of average goals by tournament. Interestingly it shows the two competitions that tend to be most wistfully remembered by England fans, Italia 90 and Euro 96, are the lowest scoring tournaments. It also reveals average goals per match are in the range 2.0 to 2.7 – with the 2014 Brazil World cup at the top of this range.
But, delve a bit further, and the distribution of goals within tournaments reveals more interesting patterns.
As the graph below shows, average goals per game is usually low in the opening round of group matches. Yet this increases for the final round. This may be because teams tend to approach the first match more cautiously with a priority of staying in the competition, whereas by the third match they may have to win to stay in the competition.
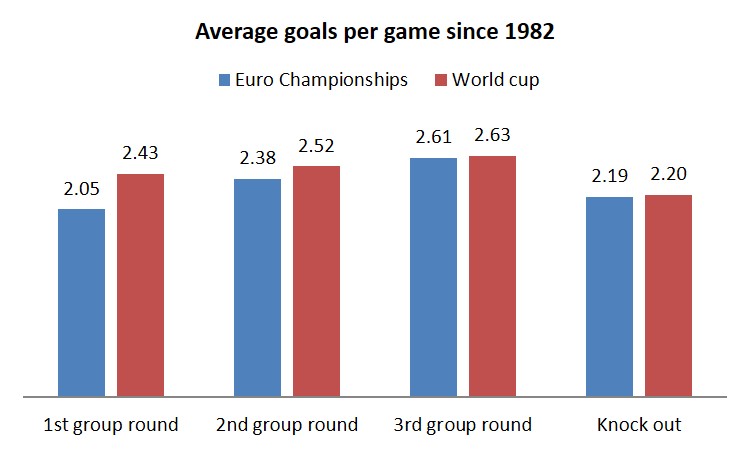
But, come the knockout stage, the average goals per game (ignoring extra time) falls again – as teams become more equally matched, and more cautious. With average World Cup knockout match goals of 2.20. This pattern applied in the 2014 World Cup, despite the incredible 7-1 semi-final victory for Germany over Brazil (which accounted for 25% of the tournament’s knock-out goals!).
A similar story applies to the proportion of draws too. The average percentage of draws for international tournaments is 28%, compared to 25% across European Leagues. But again – draws tend to be highest when teams are most cautious; with 32% of knockout matches in World Cups since 1982 ending in draws (and 41% in European Championships). And, a big driver of low average goals and draws is the 0-0 score line, the outcome for 14% of World Cup knockout matches since 1982.
I’m using data over a 34-year period, and over this period factors such as structural tournament changes, rule amendments, new refereeing interpretations and tactical progression will all affect scoring regularity. For example, what caused the Brazil World cup to buck the trend of a declining tournament goal scoring rate in 2014?
Impact of VAR
The big unknown in 2018 is the effect of the Video Assistant Referee on overall goal scoring. We haven’t got too much information in competitive internationals to assess, but evidence from leagues that have used VAR this season suggests it won’t change too much (for example – average goals in Serie A and Bundesliga have fallen from the previous season, but not outside historic ranges).
The most significant impact of VAR may be the effect it has on the flow of a match – frequent breaks (allowing teams to tactically regroup) are more likely to reduce goal scoring. It will be interesting to analyse the effect – but I won’t be accounting for it in my modelling yet.
Note – The anomaly of the 3rd place play-off
My definition of knockout matches includes the final, but not the 3rd place play-off. The 3rd place play-off is something of an anomaly for World Cups – delivering an average 4 goals per game, which demonstrates how the structure of a match transforms when the incentive changes.
