
Last November I wrote about the peculiar characteristics of Mick McCarthy’s tactical signature – copied below. In particular, his unusual ability to deliver results with a consistently minuscule pass success rate.
So, how’s he faring this season? A quick look at the stats tables reveals that Ipswich are, yet again, bottom of the pass % table – at 62.3% – even lower than the levels I discussed last year. Consistency maintained? No, not quite. The big difference with Ipswich last season is that is that the shots have dried up.
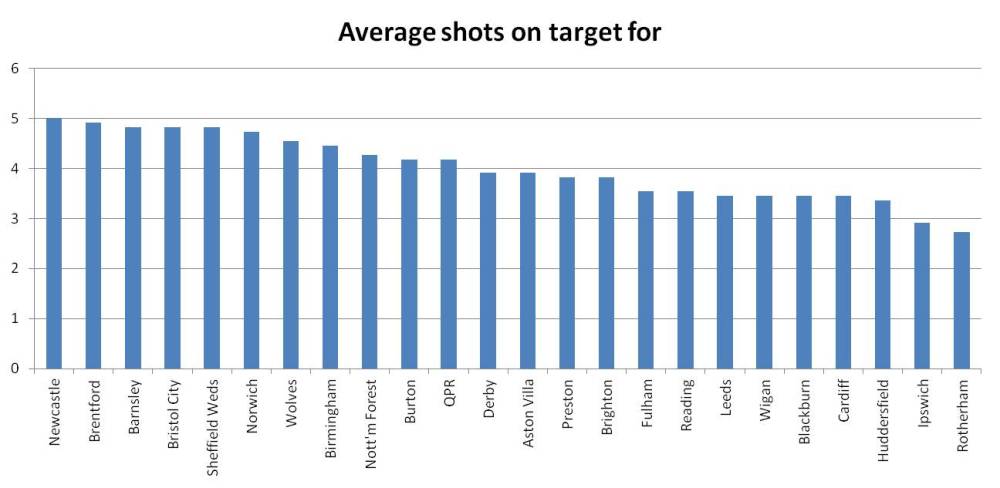
Town’s shots on target (a key measure of attacking strength) this season are 2nd lowest in the Championship.
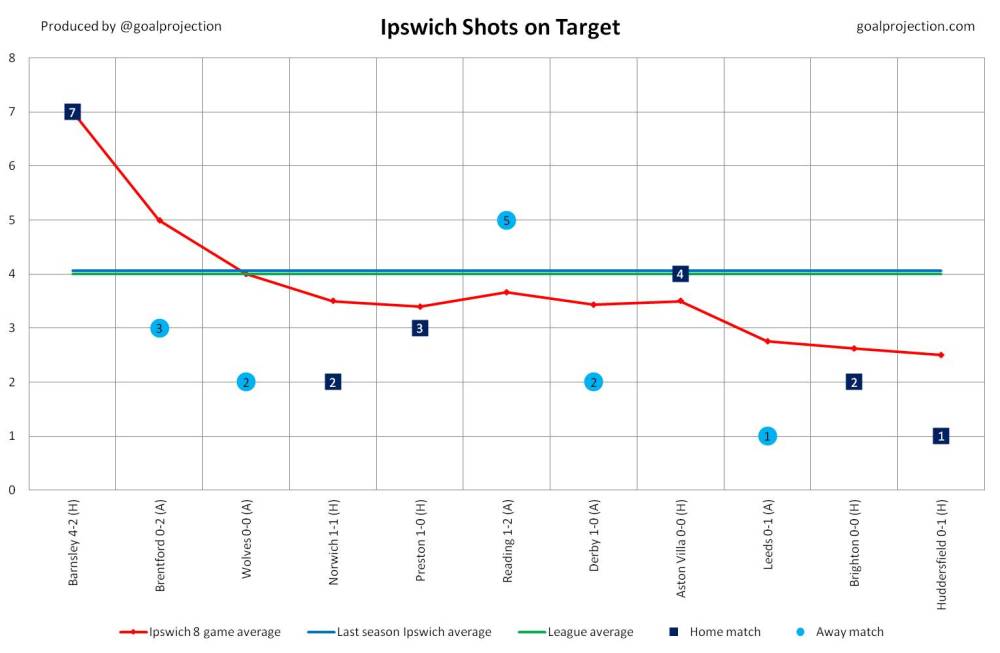
Since the opening match against Barnsley, Town’s attacking capability has been dismal, as the chart below shows.
The only saving grace is that Ipswich have also become more defensively resolute. In my article last year, the conclusion on McCarthy’s tactics was glass-half-full. Unenthusiastic, but realistic that, given’s Town’s resources, this is the only way that fans can cling to any hope of success. However, this season even that faint hope appears extinguished.
An obvious problem this season is that Town no longer have the personnel to effectively execute McCarthy’s tactics – particularly in attack, with Daryl Murphy sold to Newcastle at the end of the transfer window and David McGoldrick out with long-term injury. And, disappointingly McCarthy appears unable to adopt alternative tactics.
I hope Town’s recent form is just an unlucky streak, but the underlying shot-stats don’t augur well. Ipswich fans are in a difficult position – recognising that with current financial constraints any alternative to McCarthy could spell disaster (be careful what you wish for), but exasperated by constantly dreary tactics that no-longer even deliver results. It’s hardly surprising fans are becoming increasingly critical, despite (predominantly) holding huge respect for McCarthy.
It’s becoming increasingly apparent that Mick McCarthy’s pragmatic reign at Town may be close to running its course. What might come next is scarily (but perhaps also excitingly) uncertain.
Mick McCarthy’s magic method (November 2015)
In the modern football world, most match reports are adorned by a plethora of stats that may (or may not) tell us something extra about the relative performance of each team – e.g. BBC reports show shots, shots on target, possession and fouls. Specialist sites like whoscored.com and Squawka allow those of a nerdy persuasion to delve further and pore over shot directions, pass types, chalk boards and heat maps.
But, with so much data available, it’s difficult to work out what’s really important. As an Ipswich fan, one measure I find particularly confusing (and concerning) is “Pass Success” (that is, percentage of completed passes). Using this measure Ipswich are truly terrible. At the time of writing (22 November 2015) Ipswich sit rock bottom of a Championship table rated on pass success – more than 4% below the next lowest team Rotherham. Now, we’re just over a third of the way through the season, so it could be an anomaly. But it’s not. It’s entirely consistent with last season (bottom) and the season before (second worst after the relegated Yeovil).
| Champ 2015/16 to 22/22/2015 | Pass Success % | Champ 2014/2015 season | Pass Success % | Champ 2013/2014 Season | Pass Success % | |||
| 1 | Derby | 80.4 | B’mouth | 79.5 | QPR | 79.2 | ||
| 2 | M’brough | 79.2 | Derby | 79.2 | Derby | 79.1 | ||
| 3 | Hull | 77.5 | Brighton | 78.5 | Brighton | 78.9 | ||
| 4 | Brentford | 77.0 | Brentford | 77.6 | Leicester | 77.1 | ||
| 5 | MK Dons | 77.0 | Norwich | 76.9 | Watford | 76.7 | ||
| 6 | Fulham | 76.8 | Fulham | 76.3 | B’mouth | 76.4 | ||
| 7 | Brighton | 76.2 | Watford | 75.8 | Forest | 75.6 | ||
| 8 | Reading | 76.1 | Wolves | 75.8 | Hud’field | 74.3 | ||
| 9 | Charlton | 74.4 | M’brough | 73.8 | M’brough | 74.1 | ||
| 10 | Hud’field | 74.3 | Forest | 72.8 | Blackburn | 73.9 | ||
| 11 | Wolves | 74.2 | Leeds | 72.6 | Wigan | 73.7 | ||
| 12 | Bristol C | 72.9 | Bolton | 72.5 | D’caster | 72.7 | ||
| 13 | Bolton | 72.5 | Blackburn | 71.7 | Leeds | 72.4 | ||
| 14 | Cardiff | 72.1 | Wigan | 71.7 | Barnsley | 71.7 | ||
| 15 | Sheff Wed | 71.5 | Reading | 71.5 | Bolton | 71.5 | ||
| 16 | Leeds | 71.2 | Hud’field | 70.2 | Sheff Wed | 69.8 | ||
| 17 | Blackburn | 70.4 | Millwall | 69.8 | Burnley | 69.7 | ||
| 18 | Burnley | 70.0 | Sheff Wed | 69.5 | Reading | 69.7 | ||
| 19 | Forest | 69.6 | Charlton | 69.4 | Blackpool | 69.6 | ||
| 20 | QPR | 68.6 | Cardiff | 69.3 | B’ham | 69.1 | ||
| 21 | Preston | 68.2 | B’ham | 67.9 | Charlton | 68.2 | ||
| 22 | B’ham | 67.2 | R’ham | 67.4 | Millwall | 67.6 | ||
| 23 | R’ham | 67.2 | Blackpool | 66.2 | Ipswich | 67.6 | ||
| 24 | Ipswich | 62.9 | Ipswich | 64.7 | Yeovil | 66.6 |
Does it matter? Possibly, but probably not. The ability to pass successfully is usually a key component of a successful team. The figures above show that good Championship teams tend to be near the top of the pass Success stats – e.g. Bournemouth, Derby, Middlesbrough over the last few seasons, with Rotherham, Blackpool and Yeovil at the other end. But not always, e.g. Burnley were promoted in 2013/14 with the 17th best pass completion and they’re 18th this season.
As with most football stats, a team’s Pass Success depends on many factors – particularly a team’s tactics. The very best teams have high pass completion, Barcelona have pushed 90% in previous seasons and the top Premiership teams manage 85%. This is probably due to having better players (that can pass well). But tactics based on playing many short passes (tiki-taka football) and playing against opponents that are prepared to defend deeply will also drive up pass completion percentage.
But successful passing doesn’t always deliver successful results (the Wigan team that were relegated from the Premier League in 2012/13 are an example of this). Conversely – teams can do well adopting tactics that lead to low pass completion. This is usually teams that play more direct passes – which are less likely to be successful, but more likely to create a chance (long-balls!).
Premier league pass success stats, which go back to 2009, reveal a lot. Constructing a table for all Premier League seasons from 2009/10 to 2014/15 (120 different team finishes) – in order of pass success %, shows the bottom 24 positions as follows:
| Position | Team | Season start year | Pass completion % | Finishing Position | Manager |
| 97 | Wolves | 2010 | 71.6 | 17 | Mick McCarthy |
| 98 | Blackburn | 2011 | 71.2 | 19 | Steve Kean |
| 99 | Leicester | 2014 | 71.1 | 14 | Nigel Pearson |
| 100 | Bolton | 2011 | 71.1 | 18 R | Owen Coyle |
| 101 | Sunderland | 2010 | 71 | 10 | Steve Bruce |
| 102 | QPR | 2014 | 70.8 | 20 R | Harry Redknapp (until 3 February 2014) then Chris Ramsey |
| 103 | Birmingham | 2010 | 70.6 | 18 R | Alex McLeish |
| 104 | Burnley | 2014 | 70.4 | 19 R | Sean Dyche |
| 105 | Crystal Palace | 2013 | 70.2 | 11 | Tony Pulis (from 23/11/2013) Ian Holloway at start of season |
| 106 | Stoke | 2012 | 69.9 | 13 | Tony Pulis |
| 107 | Crystal Palace | 2014 | 69.4 | 10 | Neil Warnock (to 27/12/2014) then Alan Pardew |
| 108 | Reading | 2012 | 69.2 | 19 R | Brian McDermott |
| 109 | Stoke | 2011 | 69.1 | 14 | Tony Pulis |
| 110 | Burnley | 2009 | 68.7 | 18 R | Owen Coyle (until 5 January) then Brian Laws |
| 111 | Wolves | 2009 | 67.3 | 15 | Mick McCarthy |
| 112 | Birmingham | 2009 | 67.2 | 9 | Alex McLeish |
| 113 | Hull | 2009 | 66.7 | 19 R | Phil Brown (to 15/3/2010) then Iain Dowie |
| 114 | Bolton | 2010 | 66.6 | 14 | Owen Coyle |
| 115 | Sunderland | 2009 | 65.9 | 13 | Steve Bruce |
| 116 | Blackburn | 2010 | 64.2 | 15 | Sam Allardyce (to 13/12/2010) then Steve Kean |
| 117 | Blackburn | 2009 | 63.8 | 10 | Sam Allardyce |
| 118 | Bolton | 2009 | 63.7 | 14 | Gary Megson (to 30/12/2009) then Owen Coyle |
| 119 | Stoke | 2010 | 63.4 | 13 | Tony Pulis |
| 120 | Stoke | 2009 | 62.2 | 11 | Tony Pulis |
Interestingly this is an all British list of managers, and includes all the usual long-ball suspects. Tony Pulis and Sam Allardyce have been particularly successful at using low pass completion tactics, although not always as successful at pleasing their team’s fans – which is probably why they don’t tend to stay too long at the same club. Looking at these figures it’s hardly surprising that team owners tend to look abroad for a manager when they want a change of tactics. But of most relevance here is Mick McCarthy keeping Wolves up in 2009/10 and 2010/11 with typically low pass completion.
However, it’s wrong to believe that Mick adopts the same tactics as these other managers – there’s something more going on. The beguiling thing about Mick McCarthy’s teams is that he consistently achieves near 50% possession despite remarkably low pass completion. For example: 49.5% and 49.4% Possession in the last 2 completed seasons for Ipswich and 50.4% for Wolves in 2010. These are far higher than for other teams with low pass completion.
This seems counterintuitive because poor pass completion should deliver low possession. What I think is happening is that Mick’s teams manage to reduce opponents’ pass completion too. So passing ability is not a key priority in player selection, but positional understanding and a willingness to follow team orders is. This behaviour seems consistent with Town’s performances over the last 3 years – but I’m sure there’s much more to it.
So, going back to the question, does low pass completion matter? No, not with Mick McCarthy in charge. Mick’s tactics are unique modern football, which is why opposition managers often seem so disgruntled after losing by the odd goal to a seemingly poor Town team – they just don’t understand what’s going on. It equally explains why Mick remains so calm after a bad defeat – he knows his tactics work in the long run.
Mick McCarthy absolutely knows what he’s doing. He’s consistently delivered over many seasons. The problem is that it’s not always (or often) entertaining. Defeats can seem awful and even victories uninspiring. But, given Town’s current spending power, he is the perfect manager to deliver success.
Could he deliver promotion? It’s tempting to think that the addition of a couple of good passing midfielders will take Town to the next level. But a word of warning, the one Premier League season where Mick’s team achieved a pass completion rate greater than 75% was 2011/12 when Wolves were relegated in 20th place (ultimately under Terry Conner). Also – the two matches this season where Town achieved their highest pass completion were Reading (a) 71% and Hull (a) 75%, which resulted in 5-1 and 3-0 defeats. I suspect that if we are to progress, Town will need to become even more an embodiment of a Mick McCarthy team, rather than less.
Going back to the Pass Success stat, it’s not a great indicator of a team’s performance (there are many better, like shots on target) but it’s a brilliant measure to quickly understand a manager’s tactical approach. It’s like the manager’s signature.
As a footnote – the team currently with the lowest Pass Success in the Premier League are…Leicester City, top of the league.
