
Now that the Premier League’s unscheduled foray into added time has finished, I’ve set out my reflections after 6 months of attempting to model outcomes (with varying degrees of success).
The big picture
First thing to note; it appears to have been a strange season. Leicester’s much written about (my attempt’s here) 5000-1 success is obviously the headline, but overall the pattern of recent years seems broken. Most Premier League seasons are, more or less, a repeat of the last. As the graph below shows, correlation between successive seasons’ points has been at the 80% to 90% level. But not this season. There’s only a 49% correlation between this season’s points and last. However, take out Leicester and their antithesis (Chelsea) and things start to look more normal, with an 84% correlation.

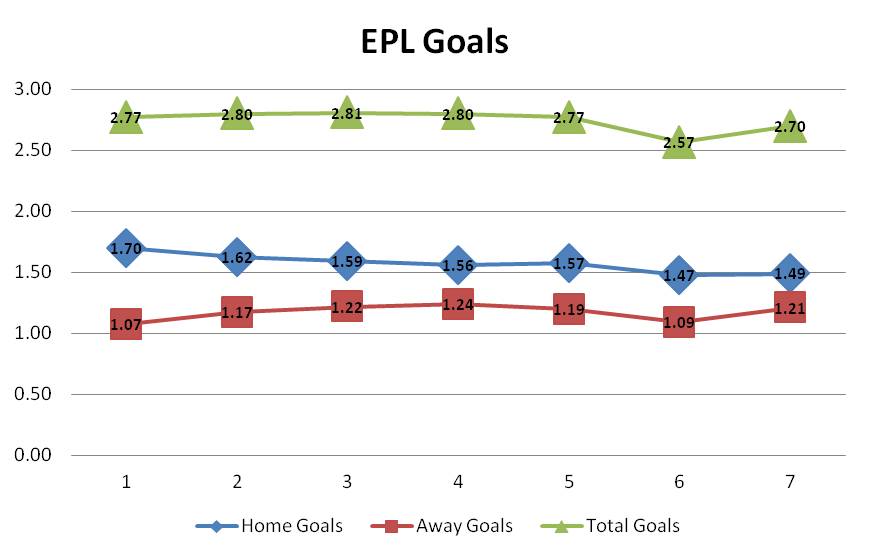
Another notable feature is reducing home field advantage. We’ve seen the difference between average home and away goals shrink to 0.28 and a low of 41% home wins. Overall average goals per game were close to the long-term average 2.70 up from last season’s 2.57.

Thoughts on selected team Performance
So, what are the conclusions from this season? I use a simple goals and shots model to assess teams. The formula is:
Adjusted goals = 45.0%*Goals + 8.4%*”Shots on target” + 2.8%*Shots, I’ve found this measure predicts future performance better than goals scored or conceded (or points attained) as explained here. And, even in this unusual season, last season’s Adjusted Goals were a better predictor than points (54% correlation).
These are my Adjusted Goals ratings for the whole season, which will also form the basis for next season’s projection.

Spurs
As I’ve noted throughout the season, Spurs look great by this measure. Their goals and shots for and against have been awesome, and unerringly consistent, right up to the last few games. They’re the top attack and, until the Newcastle capitulation, were the best defence – only to be pipped at the post by LVG’s frugal Man U backline.
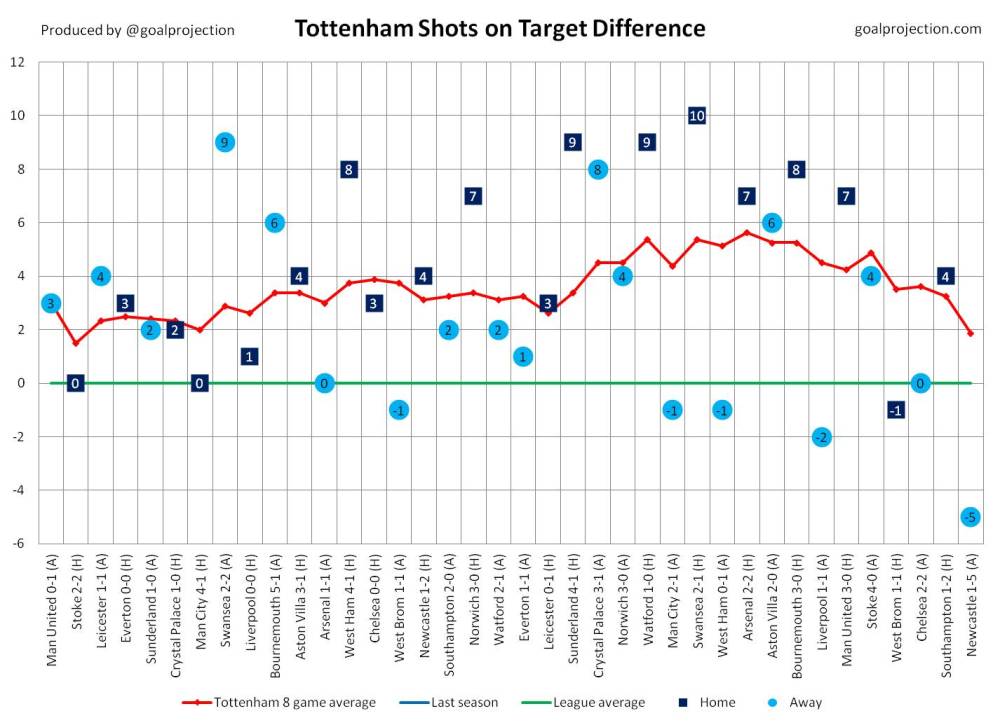
Spurs’ underlying shot numbers are unrecognizable from last season, yet they only improved by 2 places and 6 points. Achieving a Champions League place is a great step forward, but after a season of such consistent dominance – ultimately finishing 3rd behind Arsenal may feel like a case of what might have been. But, according to the shot numbers, they were the best team and are well set for next season.
Leicester City
I rate Leicester at the 5th ranked team by goal and shot numbers. Not the best, but they’re good – but they’ve also been able to manage their underlying strength better than the others to win points (probably by a combination of tactics, game management and luck). It will be fascinating to see whether they’ll maintain this level next season, especially with Champions League added to their schedule.
Manchester City
Man City, as they often do, flattered to deceive. Using their great numbers from last season and good ones from this – my modeling had them as clear favourites for the league for most of the season. They underperformed.
Chelsea
Chelsea’s performance was almost as surprising as Leicester’s. And their shot numbers are those of a mid table team. It wasn’t bad luck, they finished in the right position. As with Leicester, next season will be telling. My ratings don’t augur well for a quick return to 2014/15 dominance.
Individual Match modelling
I posted Premier League result probabilities and projected goals for each round of matches, using my adjusted goals rating system. As explained, the ratings are long-term, averaged over this season and last season so can be a good starting point for assessing value. But, because they’re long-term, there is much that they don’t take account of – such as injuries, change of tactics, new signings, players transferring out, new manager, new owner, fixture congestion or off the field problems.
So, these aren’t betting tips but an attempt to assess whether and how the market is adjusting for certain factors – which in turn might identify potential value. Even so it’s worthwhile to test the model against the market. I do this by comparing odds against maximum odds on football-data.co.uk.
There are many ways to determine which match to bet on when using a ratings model, but for this assessment I compare against the odds for the match favourite to determine value. If the difference between my model’s probability and 1/odds is 2% or more I assume a unit bet for the favourite, if the difference is -2% or less I assume risking a unit to lay the favourite.
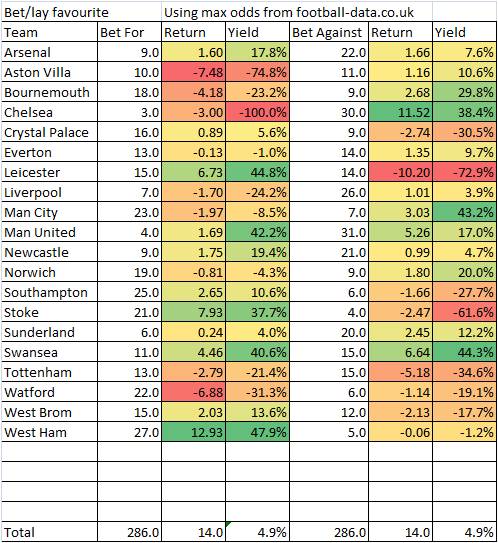
For the 2015/16 Premier League season the summary of results is a follows, using max odds from the excellent football-data.co.uk:
| Bet | Ret | Yield | |
| Bet H | 108 | -14.77 | -13.7% |
| Bet A | 14 | -2.94 | -21.0% |
| Lay H | 85 | 31.53 | 37.1% |
| Lay A | 79 | 0.13 | 0.2% |
| Total | 286 | 13.96 | 4.9% |
Overall, pleasingly, the model outperformed the market. But that’s not to say it always will (it doesn’t every season). And, it’s been a strange season where the market has poorly estimated true probability. In fact a bet on every outcome, at best market odds, would yield 4.7% – this is unusual.
It’s interesting which teams over and underperform – my model consistently identified value in betting for West Ham and against Chelsea but initially adjusted poorly for Spurs and Leicester’s form improvement since last season. Also, towards the end of the season it identified value in Aston Villa every week, indicating it doesn’t necessarily adjust well for extreme poor performance.
One thing to note is that the match modelling performed poorly at the end of the season – where there was often significant divergence between market odds and modelled probability. This reflects different motivation levels and the fact that weakened teams were often picked. Market odds fully account for these factors, my retrospective probabilities don’t.
Season Projections
I started posting full season projections at the beginning of December. My projections simulate 5000 different league outcomes. The outcome of each match is determined randomly – but each team’s average attack and defence strength comes from my adjusted goals rating system.
My first post is here, compiled after 15 matches. Leicester were top at the time, but I’d predicted they finish 4th with an expected 63.1 points. Way off their final total of 81 points – but this was at a time when many still doubted they’d make Champions League.
As mentioned it also overestimated Man City (and Villa, even though I had them at 58% to finish bottom).
Also, as I pointed out at the time, in January, my model – as well as many others, assumed that there were only 2 realistic title contenders: Arsenal and Man City, with only 10% chance for the field. The betting markets outperformed models here – giving the field (mostly Leicester and Spurs) a 17% chance. I think that is my biggest lesson here – even though I do allow for some variance around a team’s assumed ranking, it looks like it should be larger – to better allow for chances of significant form shifts.
Conclusion
My modelling method isn’t sophisticated and could probably be improved by adding more variables, such as player strength. But as a way of simply illustrating likelihood and identifying reasons for market variance – it’s worked well, and I’ll carry on with the method for next season. I’ll also possibly overlay an element of informed subjectivity (my judgment) to see if this performs better.
In the meantime I’m turning my attention to modelling Euro 2016!
