
One of the trickiest parts of modeling football match outcomes is assessing the likelihood of a draw. In football, unlike many other sports, draws are quite frequent (around 26% of matches). This means that to get a good estimate of the chances of either team winning any assessment of draw likelihood needs to be robust.
I think that there are 3 main factors that determine draw likelihood:
- Expected difference in goals scored between the home and away team. The closer the expected score the greater the draw likelihood.
- Total goals expected. Intuitively the fewer goals expected the greater the draw likelihood, because the chance of a 0-0 result is higher – ultimately tending to 100% as total goals expected tends to 0.
- How comfortable either team is to accept the draw as a good result. If both teams are happy to accept a draw, obviously draw likelihood will be high.
The first 2 are relatively easy to model, the 3rd factor is more subjective.
I base my modeling of match scores on a Poisson Distribution – but also adjust for observed match outcomes, for example the 0-0 result tends to occur more frequently than implied by a Poisson Distribution.
This gives the following draw distribution for English Premier League matches.
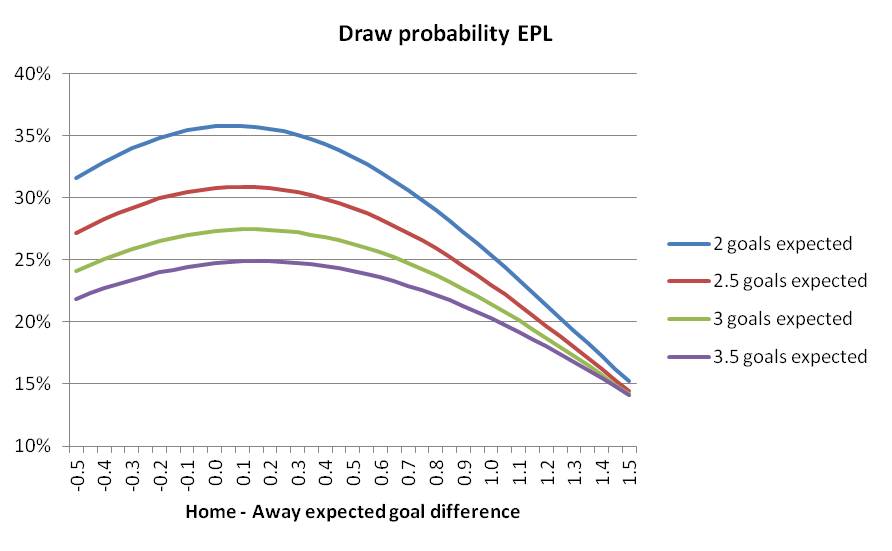
As the model takes account of observed values it makes some allowance for the third factor above. But to properly determine how comfortable either team is to accept a draw an individual match assessment is needed. This will include factors such as the context of the match (e.g. do either team need to win), managers’ tactics in similar matches and team line-ups. There are also probably cultural differences between countries, which means a draw is more acceptable in some countries than others.
This means that the distribution of draws is different in different leagues.
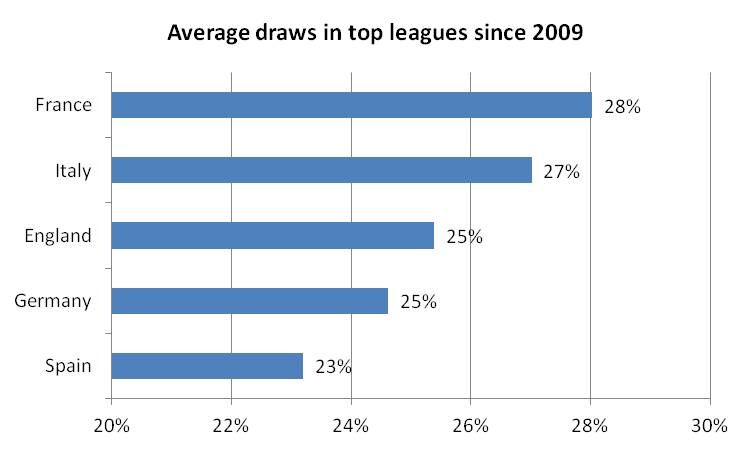
This chart shows average draws in different counties over the last 6 seasons. French football tends to have the highest draw incidence, this may be cultural, but also due to the fact that there are fewer goals scored on average. Spain has the fewest draws – I’m not sure why, but it strikes me as a logical not to accept a draw (and share the points) when 3 points is on offer for a win – so perhaps La Liga is more tactically efficient?
